The Problem With Google's AdWords Reports
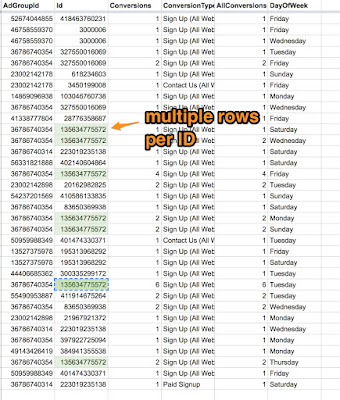
Here's what the typical output from an AdWords report looks like if you use a script like this one to add it in a Google sheet.Here's why I don't like getting my reports this way... In a typical AdWords optimization, I might evaluate a keyword to see if it meets certain criteria, and when it does, change the bid. For example, for keywords with more than 5 total "Sign Up" conversions, and at least 2 of those conversions on today's day of the week, I might raise the bid.
This is not easy to do with the spreadsheet above because I can't simply build a formula for each row as that would ignore the data from the other 6 rows about the same entity.
A Better Format for AdWords Reports
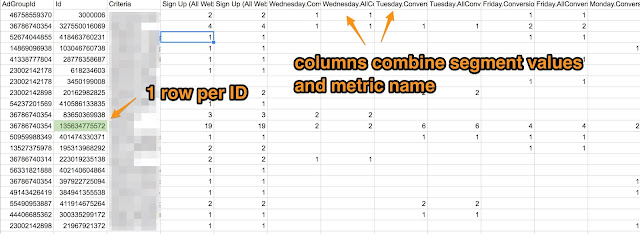
To get the report the way I want, I need to do some vlookups and data aggregation so that all the data for a keyword is moved onto a single row. This is what my spreadsheet should look like to make optimizing easy: |
| AdWords report data that is aggregated by entities. Here there is one row for every keyword along with one column for every combination of metrics and segments. |
Now you can see there is only 1 row for that same keyword ID as before (highlighted in green). Now I can write a spreadsheet formula that has access to all the elements I need on one row.
How Scripts Solved This Problem
To get the spreadsheet output in the format I wanted, I wrote a script that finds all possible values for the included segments and then combines this with the different metrics. For example, possible values for the DayOfWeek segment are 'Monday', 'Tuesday', 'Wednesday', etc. Combining this with my metrics, I get Monday.Conversions, Monday.AllConversions, etc. Each of these is then treated as a column in the sheet.So now I can more easily do my optimization. I could also feed this sheet into a tool like Optmyzr's Rule Engine so that I could start automating account management based on factors like day of week, type of conversion, or any other segment I include on the sheet. Optmyzr is my company and also runs this blog.
How to run this script:
After installing the script code that's all the way at the bottom of this post into an AdWords account (a child account, not an MCC account), you can edit the following settings to customize it:- attributes: these are the AdWords reporting attributes. You will get a single spreadsheet row per unique combination of attributes
- segments: these are the AdWords reporting segments. The values of each segment will be joined with metrics and create 1 column for each combination
- metrics: the AdWords reporting metrics to include.
- sourceReport: the report type from Google. See the link below for more information
- spreadsheetUrl: the Url of the Google spreadsheet that this script will update.
- tabName: the name of the sheet (tab) in the spreadsheet that should be updated.
- reportVersion: the version of the AdWords API reports you’re using. The data available in the Ads API changes periodically so this ensures our script talks to the right version of AdWords.
Where to Find Valid Settings for the Script
Here is the list of acceptable attributes, segments and metrics for the keywords performance report:https://developers.google.com/adwords/api/docs/appendix/reports/keywords-performance-report. As you can see, Google makes it really easy to see what are attributes vs. segments vs metrics. Just be sure to populate the right settings in the script based on what type of data you're adding.
So for example, if you wanted to add ApprovalStatus to the report, you'd put add it to the comma separated list of attributes as seen here:
Here is the full list of all AdWords reports with the available attributes, segments, and metrics to help you create correct settings.


